Showing posts with label Social Networks. Show all posts

Thursday, November 8, 2012

Network Dynamics & Coupling: Shannon’s Reverie Reprised . . . updated


Shannon’s (fictional) Reverie . . .
Claude Shannon woke up one morning and said to himself, “Think of how our brains operate – it habituates to repeated stimuli but pays attention to a rare stimulus; things that are rare must carry a lot of information!” So, what do I know about quantifying rare or unlikely things? I know that things that are highly likely are highly probable; so unlikely-things or novelty can be thought of as the inverse of probability. But snap! Probability goes from 0 to 1; I need a “squashing” function around it so that the novelty measure does not blow up fast but at the same time, very low probability things (highly novel things) are highly weighted. How about . . .?


A bit of cleanup via taking expectations, probability density functions and some proper logarithms and we have Shannon’s famous equation for “information”,


When you reduce a (joint) probability density function to a scalar, there is a lot that you throw away; the “trick” is that the scalar that you come up with captures some aspect of reality that is *useful*. As the explosion of communication technologies in the past few decades shows, Shannon’s scalar sure did!

I am not claiming that this is how Shannon did his research but this is one way to approach new insights that you may have and their quantification.

Social and Other Networks:
In my recent blog on Social Networks, “What does ‘Emergent Properties in Network Dynamics’ have to do with Shopping?”, I noted the following: “Facebook connects us in a vast network – this is only a first step. The deep reason for the fascination with social networking can be understood from the shopper example. Shoppers are enmeshed in an ever-changing network of social interactions and preferences. Today in Retail Analytics, data are treated as isolated bits of information. In reality, data exist in *embedded* forms in preference and influence networks of the shopper as well as distributed in time and space.”

As you know, interest in understanding such Social Networks and controlling their “dynamics” via “influence functions” of nodes, etc., are at a fever pitch – advertising, retail and many other day-to-day eCommerce activities can benefit from a better conceptualization and quantification of social network dynamics.


We know that “coupling” in networks generate very interesting dynamics (see, Steven Strogatz, “Sync: The emerging science of spontaneous order”, 2003, for a very readable overview).  Consider the ultimate of all networks – the brain. When we do “brain mapping”, interesting patterns arise. The brain mapping pictures show scans of a “depressed” and a “non-depressed” person. In the Depressed case, the brain regions are NOT coupled whereas in the non-depressed or Normal case, there is significantly more coupling and more uniform activity across the entire brain. Note however that if we looked at such a scan for an epileptic patient during a seizure, the scan will be all “lit up” showing nearly-complete coupling – that is a degenerate case!

Reprising the Reverie . . .
Coming back to healthy coupling and following Shannon’s (fictional) thinking process outlined in the first paragraph, what do I know about quantifying “coupling”? I know that when the underlying sources are coupled, their “stimulation” of the neocortex is uniform and they show up equally across the network at the same time, much like a single “wavefront” that reaches all the regions simultaneously. Imagine you are at a beach looking out to the sea and gentle waves are rolling in – let us say in parallel to the beach. If you are standing knee-deep in the water and look in a direction parallel to the beachfront (i.e., up or down the beach), the spatial frequency in your “look direction” (or the frequency of “corrugation”) is 0 cycles/meter! Much like the ocean waves, the single waverfront of stimulation is nearly “constant” across the distributed neocortex and its relevant strength can be thought of as the power at zero frequency.

I happen to know that power at zero frequency is called “Scale of Fluctuation” or “θ” in random field theory. From the previous work of Eric Vanmarcke (“Random Fields”, 1983, with an updated edition in 2010),
For the initiated, the equation and the accompanying figures below are hugely meaningful! In the figure, the “height”, (g(0) times π ) and the “area” under the normalized autocorrelation function, ρ(τ), are marked in blue – this is “θ”! This is the graphical meaning of Vanmarcke’s equation for θ.


The result shown above is for a time series. For the brain mapping case, “θ” is 4π2g(0,0) of its 2-D normalized spectral density (same pattern follows for higher dimensional random fields). Calculations of θ for 1-D and 2-D cases are straight forward; ways to calculate “instantaneous” values of θ are also available using Kalman Filtering (introduced in my past publication, “Instantaneous Scale of Fluctuation Using Kalman-TFD & Applications in Machine Tool Monitoring”). Some curious properties of θ for 2nd order linear time invariant systems were also developed there. To recap the highlights –

From discrete-time linear time-invariant system principles, we know that constant damping ratio and undamped natural frequency contours in the z-plane are as shown on the left.
It is notable that for a second-order system, the constant θ contours shown on the right have remarkably simple geometric shapes. In fact, for θ = 1, the equation is quartic but very similar to a circle with origin at (0.5 + j0) and radius = 0.5!

Equation for θ = 1 contour is (x2 + y2) 2 + x2 + y2 – 2x = 0

There are more details in PG Madhavan, Theory and estimation techniques for Random Field Theory and "Theta" with practical applications: Instantaneous Scale ofFluctuation Using Kalman-TFD & Applications in Machine Tool Monitoring, SPIEProceedings, SPIE Vol. 3162, pp. 78-89, 1997.

Similar to Shannon’s scalar, H, θ reduces the joint probability density function to a scalar. Does θ capture some aspect of reality that is useful? The constant θ contours above seem to imply great significance as fundamental as natural frequency and damping – but at this time, such insights are not forthcoming!

Similar to Shannon’s scalar, H, θ reduces the joint probability density function to a scalar. Does θ capture some aspect of reality that is useful? Some real-world applications of θ from the past (see its use for machine tool chatter prediction) point to the following physical insights.


While highly speculative, previous studies and our “Shannon approach” suggest that θ is proportional to “coupling” and to “order” in a distributed node system whereas it is inversely related to “degrees of freedom (df)”. In the case of “df”, the concept is that more degree of freedom is a “dangerous precipice” for a distributed system where different parts are de-synchronized and they can spin off in different directions - pandemonium can ensue!

Large θ seems to indicate an ordered, widely-cooperative and well-functioning network; however, it is conceivable that a large θ may also indicate degenerate cases such as epileptic seizure or full-fledged chatter conditions (extreme cases of coupled sources and distributed action). An example is shown below.

Large θ on the left is a hallmark of “distributed order” whereas the large θ on the right, that of “locked-in order”. Low θ condition in the middle is visually indicative of disorder and the potential for degeneracy!


θ in Social Networks:
To help develop our intuition, let us consider some snapshots of geographcally distributed network maps. We have (1) Internet activity over continental United States, (2) LinkedIn infographic map and (3) Facebook social network map.

We notice strong coupling in the Eastern half of US among Internet nodes and similar features in the LinkedIn and Facebook networks. Our intuition is that the *bright spots* obvious in the Northeast US of the Internet map or the EU area in the Facebook map indicate more “correlated” activity. For simple network maps, we have developed primitive methods to estimate θ based on correlation functions.


Before we leave this blog, consider the brain map and the US map of the Internet. What we see in these pictures can be called “surface structure”, i.e., observed or measureable quantities. In the brain, the Surface Structure is created by activity deep within the brain (I am NOT referring to Chomskian linguistics model here). In the past, naïve physical modeling has conceptualized dipole oscillators in the “deep structure” of the brain giving rise to the Surface Structure as a starting point for theorizing. In the case of the brain, there are indeed Deep Structures (nuclei and ganglia and their dendritic potentials) giving rise to voltage variations on the scalp surface (earthquake tremors recorded on the surface of the earth and activity deep in the earth’s crust form a similar model).

Clearly, the Surface Structure of the Internet cannot be related to any actual Deep Structure in a physical model – there is no mechanical turk behind the Internet pulling the strings! However, even in such cases, conceptualizing observed activity as the resultant of implicit Deep Structure may be useful in developing analysis methods. The hope is that the physical model of network activity utilizing the concept of explicit or implicit deep structures with internal coupling will help advance our “analytics” tools for the extraction of patterns and information from spatially and temporally distributed networked systems.


www.JINinnovation.com
Dr. PG Madhavan was CTO Software Solutions at Symphony Teleca Corp. Previously, he was the CTO & VP Engineering for Solavei LLC and the Associate Vice President--Technical Advisory for Global Logic Inc.  PG has 20+ years of software products, platforms and framework experience in leadership roles at major corporations such as Microsoft, Lucent, AT&T and Rockwell and startups, Zaplah Corp (Founder and CEO) and Solavei. Application areas include mobile, Cloud, eCommerce, banking, retail, enterprise, consumer devices, M2M, digital ad media, medical devices and social networking in both B2B and B2C market segments.  He is an innovation leader driving invention disclosures and patents (12 issued US patents) with a Ph.D. in Electrical & Computer Engineering.  More about PG at www.linkedin.com/in/pgmad

Saturday, October 20, 2012

Analytics: New Insights & Actions in Brief


Facebook connected us in a vast network – this is only a first step. The deep reason for the fascination with social networking can be understood from an example. Shoppers are enmeshed in an ever-changing network of social interactions and preferences; desirable behavior can be made to emerge by perturbing the interactions within the network.

Insight #1: Network embedded data.
Today in Analytics, data are treated as isolated bits of information. In reality, data exist in *embedded* forms in preference and influence networks of the shopper as well as distributed in time and space. There are few if any analytics techniques that explicitly exploit embedding – if new ones do, such techniques will be very powerful.

Insight #2: Closing the Analytics Loop.
Analytics extract meaningful patterns and information from raw data. But what do we do with those insights? The promise of Analytics will be fulfilled only when we close the loop via actions that lead to profitability in the broad sense. Emergent Marketing is an example of closing the loop of “analytics” drawn from retail data and shopper network activity back to the customer generating purchase activity and additional new analytics.

Insight #3: Emergent Marketing.
Emergent Marketing is a low-level multi-node intervention in a human social network that creates the emergence of a ground-swell of a desirable activity (“emergent” activity) without identifiable one-to-one causality. In a “crawl-walk-run” approach to developing full-fledged Emergent Marketing techniques, JIT Branding is a “slow crawl”.

Insight #4: Just-in-time Branding.
JIT Branding using Linear Influence Model (LIM) is a primitive Emergent Marketing tool. LIM models minimally incorporate the dynamics and the ability to perturb the network in a fine-grained manner. The design and number of “contagions” for the emergence of desirable “ground-swells” of activity are also open issues at this time.
·          The true value of LIM modeling for JIT Branding is that key shoppers’ influence functions are estimated from historical data. In general, these influence functions are not available and naïve guesses have to be employed (such as exponential decay).

Closed-loop Analytics:
Insights from analytics can be “closed” in multiple ways: via the shopper, via merchandising and via many stages of the supply chain. Our focus is on closing the loop via the shopper; they involve advertisements, discounts or loyalty programs plus new approaches.
1.       Proximity Marketing using Passive Organic Search™ - implemented (New).
2.       Viral Marketing using Shop Ally™ - ready for implementation (relatively NEW).
3.       Emergent Marketing using JIT Branding™ - technology ready (brand NEW).

More details at . . .
o    “Emergent Marketing: A New Force in Social Commerce”http://pgmadblog.blogspot.com/2012/10/emergent-marketing-new-force-in-social.html
o     “What does ‘Emergent Properties in Network Dynamics’ have to do with Shopping?” http://pgmadblog.blogspot.com/2012/10/what-does-emergent-properties-in.html
o     "Business IPTV Service – A New Cloud Business Vertical" http://pgmadblog.blogspot.com/2009/09/advertisers-are-always-looking-for-ways.html


Dr. PG Madhavan was CTO Software Solutions at Symphony Teleca Corp. Previously, he was the CTO & VP Engineering for Solavei LLC and the Associate Vice President--Technical Advisory for Global Logic Inc.  PG has 20+ years of software products, platforms and framework experience in leadership roles at major corporations such as Microsoft, Lucent, AT&T and Rockwell and startups, Zaplah Corp (Founder and CEO), Solavei and Aldata. Application areas include retail, mobile, Cloud, eCommerce, banking, enterprise, consumer devices, M2M, digital ad media, medical devices and social networking in both B2B and B2C market segments.  He is an innovation leader driving invention disclosures and patents (12 issued US patents) with a Ph.D. in Electrical & Computer Engineering.  More about PG at www.linkedin.com/in/pgmad

Friday, October 12, 2012

What does ‘Emergent Properties in Network Dynamics’ have to do with Shopping?


Dr. PG Madhavan was CTO Software Solutions at Symphony Teleca Corp. Previously, he was the CTO & VP Engineering for Solavei LLC and the Associate Vice President--Technical Advisory for Global Logic Inc.  PG has 20+ years of software products, platforms and framework experience in leadership roles at major corporations such as Microsoft, Lucent, AT&T and Rockwell and startups, Zaplah Corp (Founder and CEO) and Solavei. Application areas include mobile, Cloud, eCommerce, banking, retail, enterprise, consumer devices, M2M, digital ad media, medical devices and social networking in both B2B and B2C market segments.  He is an innovation leader driving invention disclosures and patents (12 issued US patents) with a Ph.D. in Electrical & Computer Engineering. More about PG at www.linkedin.com/in/pgmad

Can you think of a framework that considers everything that humans do? Such an attempt borders on hubris! In any case, is there a “concept” (or concepts) under which we can understand all human-scale activity? Try ‘Emergent Properties in Network Dynamics’ concept on for size! We will explore how this concept holds up by thinking about a practical day-to-day “shopper scenario”.

Facebook connected us in a vast network – this is only a first step. The deep reason for the fascination with social networking can be understood from the shopper example. Shoppers are enmeshed in an ever-changing network of social interactions and preferences; desirable behavior can be made to emerge by perturbing the interactions within the network.

Let us explore the fundamentals . . .

Thinking About Network Dynamics:
We know networks – social networks, neuronal networks, societal networks, family networks and so on. They are characterized by nodes and connections among them. There is another important network characteristic – it’s “dynamics” or changes over time. Time is only one of the possible fabrics over which networks evolve (or explode); another could be “space”.

Consider the time before flight. Communicable diseases in one region of the world were not very likely to spread to far-flung regions in days. After airplanes, the space dimension “shrank”; SARS and AIDs spread much more rapidly among the human network to many parts of the world. So dynamics of the network in some cases have an important spatial dimension and the dynamics changes as new inventions and technologies proliferate. New developments can also render spatial dimension insignificant for certain “infections”. Think of the Internet and the spread of information. Before the Internet, news of Chinese leadership intrigues would have taken a long time to reach US shores. With the Internet, as far as information spread is concerned, space dimension is largely obliterated.

Thinking About Emergent Properties:
Why do we talk about “emergent” instead of “emerging”? The Joint Information Systems Committee in the UK has a convenient definition: “In systems theory emergent properties of the system are those that can’t be explained in a reductionist manner, that is to say, by the actions of the constituent parts of the system, but rather which arise from the interaction from those parts. The basic idea is well captured in the ordinary language phase ‘the whole is more than the sum of the parts’. Emergence can be observed in both the natural and the social world. A common example from nature is colour. Elementary particles have no colour, but when they are combined into atoms, they begin to absorb specific wavelengths of light.”

This definition is a good springboard to our understanding of the Emergent Properties concept. Remember your high school Physics? You know of atoms and nuclei and electrons. You can combine them to form molecules such as H2O or water. Water has some physical properties such as viscosity, surface tension, etc., that are not apparent at the atomic level. Water can go through “state transitions” under certain conditions (such as lowered temperature) to become ice. Ice has an “emergent” property of being a solid, totally unsuspected when it was water. Sometimes, you need external agents such as impurities (or intentional catalysts) to “seed” the crystallization process into ice. Water under certain other conditions (say, heat) can transition to another state such as vapor which has very different physical properties from ice. These state transitions and resulting emergent properties are the stuff of Nobel Prizes. Anderson (1977 Nobel winner) has made important contributions to concept of emergent phenomena (http://en.wikipedia.org/wiki/Emergent_phenomena).

The website above explores emergent phenomena in philosophy, religion, art and human sciences; there are brief discussions on topics such as emergent properties and processes in physical systems, biological systems, economics, the World Wide Web and the Internet. Cuts a very wide swath indeed!

In summary, an emergent behavior or emergent property can appear when a number of simple entities operate in an environment, forming more complex behaviors as a collective. Though not widely accepted in Complexity theory circles, I also believe that “seeds” are important in precipitating emergent behaviors (lower temperature is a necessary condition for water to freeze but not sufficient; impurities (“seeds”) are required for crystallization to occur). A group of shoppers connected by social networks can exhibit emergent behavior (of increased foot traffic to a store location) if we seed the network with the appropriate spot-discounts spread across portions of the social network.

Putting Emergent Properties & Network Dynamics Together:
Consider our brain – billions of neurons and trillions of synapses. Neuron bodies tend to cluster together into nodes or ganglia. Network connectivity among them is via long axons or short dendrites. In recent years, Neuroimaging scientists have made a living out of locating specific activity or emotion or intelligence at specific brain sites. Such images are produced by massive averaging of activities over subjects, task and time; considering how human being processes information on the go in milliseconds, these experimental conditions have little similarity!

Also, consider the recent revelations about “junk DNA”. “Coding DNA” was where all the action was supposed to be. But lo and behold, we now find that junk DNA dynamics determines when the coding happens and in what sequence and proportion, which is what gives rise to proteins that can create various disease states. Similarly, I believe that it is the dynamics of neuronal network that codes for information storage and processing. In other words, there is no physical locus of a CPU-like intelligence processor or RAM-like memory store. The pattern of neuronal activity (akin to junk DNA dynamics) over the space of the brain and over time determines the information processing that goes on in our brains. So if you look for a brain location to explain a specific human activity, just like considering Coding DNA only, you will get a partial and frustrating picture that is tantalizing but never complete in explaining how thoughts or actions happen!

Network Dynamics picture complicates life considerably. Current medical research tools are totally inadequate to measure specific activity of many millions of neuronal nodes and connections over time and space while an intact human being is performing complex tasks. Therefore, we have to resort to “concepts” instead of testable theories at this time. Let us embrace Network Dynamics as a valid concept for modeling the activity of the brain, society, family, etc.

Within the social, family or brain network and their dynamics, how do behaviors and actions arise? How can we modify them? For example, if we had a societal network dynamics model for infections, can we modify (and eventually stop) the spread of viruses such as AIDs or flu? How do pandemic patterns emerge in these networks and can we predict them so that we can position first responders at the right place ahead of time?

Putting Emergent Properties & Network Dynamics To Work:
Let us consider a down-to-earth business problem and see how we can apply the concept of Emergent Properties in Network Dynamics. We are all shoppers at one time or the other (mostly weekly for household items) – let us see how we can make shopping delightful and profitable for both the shopper and the retail shop using the concept of Emergent Properties in Network Dynamics.

Retailer wants two issues addressed: (1) how to attract shoppers and (2) how to encourage a specific shopper action such as purchasing an item. To attract shoppers in general, retailer can make the aisles wider, décor attractive, etc. To encourage me, a specific shopper, to make a purchase the retailer can recommend specific items to me for purchase (a la Amazon Recommendations). Both involve Network Dynamics since in one case, all shoppers are “connected” in some fashion or the other (by the simple fact that they shop at this store) and in the individual shopper case, I am networked to bunch of my friends and relatives whose shopping preferences affect mine. Utilizing our new-found concept of Emergent Properties in Network Dynamics, the retailer’s objective is to (a) represent and understand emergent properties such as collective behaviors and (b) design interventions in the network so that desirable actions emerge and undesirable actions are suppressed (applicable to both the individual shopper as well as to a group of shoppers).

Let us map the concepts of Emergent Properties and Network Dynamics to the shopper scenario. At this point, it will be helpful if you review the Social Network section of my earlier blog, “So-Mo-Clo Framework for CUS”, http://pgmadblog.blogspot.com/2012/07/so-mo-clo-framework-for-cus-dr.html.

If a social network graph of the shoppers at this particular store was created, you will see that some shoppers are well-connected (called “Hubs” denoted by “H” in the figure) but most are “Clusters” and “Cluster Groups” corresponding to our family, work and play groups. This is a one-time or “static” map of the network. Denoting its dynamics is not easy in such a graph.

If we recreated this network graph at some time intervals and considered a collection of them, we may be able to see the dynamics of the overall network graph (in practical terms, this is difficult to visualize since there are many nodes and they may change positions).


A more tractable problem is to track an individual shopper over time (or space) and give up on the much more desirable collective evolution (purely due to the limitations of current techniques). Any individual shopper can be denoted by his “attributes”. Attributes could be physical (such as height and weight), products he buys or attributes of the products he buys (cheap, sweet, fried, etc.). In abstract terms, Shopper exists as a point in an A-dimensional space where A is the number of independent attributes (this is similar to denoting a location in physical space as a point on an X-Y graph but in this case, with many more than 2 dimensions). Over time, if we repeatedly measure this shopper’s attributes (such as likes and dislikes of various products), his location (marked by “X” in the figure) in the A-dimensional graph will move around as his likes and dislikes change. If we connect these points (fuzzy blue path), we will get a “trajectory” in the state space (or attribute space in this case) of this particular shopper denoting dynamics over attributes. We will call this “Shopper Attribute Map”.

(For the initiated, this sets the stage for eigen-decomposition of shopper “attribute space”. Even though, Attributes 1 through A may be independent, they may not be the best set of orthogonal coordinates to represent the shopper – the eigenvectors are always the best (due to ‘compactness’). It is also likely that a set of axes less than A will represent the shopper better. This reduced eigen-representation forms the basis of most of the sophisticated recommendation engines).

So now we have a somewhat satisfactory pair of methods to represent the network and dynamics. How do we bring in Emergent Properties into the picture? Remember that the retailor wants two things: (1) attract shoppers and (2) a specific shopper action.

A trivial method to attract all shoppers is for the retailor to give away a crisp $100 bill to every shopper when they check out – every shopper in the neighborhood and beyond will show up! However, his business situation may not allow such an intervention. Retailor wants to create a state transition using more of a business friendly intervention such that a desirable emergent property appears (such as a step-change increase in foot traffic).

Without interventions or “seeding” to precipitate emergent properties, we are left to simply simulating/ modeling collective shopper behavior. This in itself is useful in that we can observe patterns such as Hubs and Clusters. More interestingly, just as cooling and seeding (with impurities or catalysts) engendered the emergent property of “solid” from water, the retailer can identify the conditions and interventions to attract all shoppers. Understanding of how infections spread in a network helps him in this effort. Linear Infection (or Influence) Model introduced in my blog mentioned earlier (“So-Mo-Clo Framework for CUS”) provides the methodology.

“Viral” marketing is an exact analog of the Infection Model. Using the social networks of the shoppers, the retailer can offer store-credits to a “Cluster Group” if they can reach some purchasing target as a group (such as buy 10 items of a specific brand in 2 days) – very useful in clearing the store shelf of about-to-expire merchandise. Using the “Hub” to spread this viral message, the retailor may be able attract an even larger contingent of shoppers to his store.

Retailer also wants to precipitate a specific buying behavior (treated as an emergent property here) within a specific customer. It is well-known that the most opportune time to influence a shopper and set the stage for conversion to purchase is during the purple-shaded portion (Interest-Desire-Action phase) of the Purchase Funnel in the figure. “Proximity” marketing identifies shopper’s interest via techniques such as Passive Organic Search™ and proffers immediate spot-discounts via shopper’s mobile phone or other in-shop displays. It may appear that influencing an individual shopper is not a “network” emergent property since an individual is identified and separately targeted for a spot-deal that is tailored to him. The point to note, however, is that for the most effective targeting of a promotion or offer to a particular shopper, we have to consider him as a node in a network that includes his social network which creates latent influences and perhaps also his “Shopper Attribute Map” made up of his likes and dislikes. Merging of these two gives the most complete and powerful network graph of the shopper to guide the Proximity marketing actions.

Lessons Learned:
·         Collection of Shoppers forms a social network.
·         An individual’s social graph and her attribute map constitute her total network.
·         Networks have temporal (and spatial) dynamics which are hard to model; an approximate approach is to recompute them repeatedly.
·         Shopper and her attributes may be modeled more compactly using their eigenvector space (in other words, distance metrics can be ortho-normalized which will improve recommendation systems).
·         Influence/ Infection model can be used to proactively study emergent properties due to interventions allowing fine-tuning of marketing strategies (Viral or Proximity) before actual deployment.

What does Emergent Properties tell us? If we want specific shopping behaviors, we need to remember that the shopper is embedded in a social graph and an attribute map. Viral and Proximity marketing are but primitive techniques to perturb the network. Embedding produces many influences and constraints on the shopper that may be varying.

For predictable success, new marketing techniques will emerge designed to create desirable emergent behaviors (beyond using one-to-one causal relationships) in a cohort of shoppers in their network-embedded state; let us call it “Emergent Marketing” as opposed to the traditional “resultant” marketing that is cause-and-effect aimed at a stand-alone individual.

Some general comments:
·         Hubs in the networks should be afforded “concierge-level” customer support because of their wide influence.
·         Products can also have “social graphs”; they are nodes of a network that are connected by links such as manufacturer, low-cal, green or organic, salty, and many more. Such a Product Social Graph will find applications in merchandising which will be of interest to CPG manufacturers and Retailors.
·         New frontiers of R&D lie in merging People and Product social graphs, improving the modeling of dynamics in social graphs and better perturbation techniques (“Emergent Marketing”) to create purposeful emergent properties in the network and its dynamics.

Within the current state of the art, we are limited in fully describing the network dynamics of shoppers. We have to rely on the shopper social graph (and the relationships along with decoding messages being passed among the nodes) and an individual’s Shopper Attribute Map. Given the graph and map as a-priori information and the Influence Model, we can design interventions via viral and proximity marketing to create certain desirable emergent buying behaviors of the shopper as an individual or shoppers as a collective.

Monday, July 30, 2012

“So-Mo-Clo Framework for CUS”


Dr. PG Madhavan is CTO at Symphony Teleca Corp for the ISV division. 
 
Previously, he was the CTO & VP Engineering for Solavei LLC and the Associate Vice President--Technical Advisory for Global Logic Inc
.
PG has 20+ years of software products, platforms and framework experience in leadership roles at major corporations such as Microsoft, Lucent, AT&T and Rockwell and startups, Zaplah Corp (Founder and CEO) and Solavei. Application areas include mobile, Cloud, eCommerce, banking, retail, enterprise, consumer devices, M2M, digital ad media, medical devices and social networking in both B2B and B2C market segments.  He is an innovation leader driving invention disclosures and patents (12 issued US patents) with a Ph.D. in Electrical & Computer Engineering. More about PG at www.linkedin.com/in/pgmad

One of PG’s relevant blogs, “Jell-O Mountain Approach to Product Innovation” can be found here: http://pgmadblog.blogspot.com/2010/04/jello-mountain-approach-to-product.html

 “Social-Mobile-Cloud for Connected User Services” – an emergent framework to create and deliver services to network-connected users. Can this framework be applied to humans and devices? Yes! Can it be used in the enterprise and for personal use? Yes! Is this something new? Not really . . .

So-Mo-Clo is the result of progressive maturation of mobile devices, cloud computing and social networks. “Social” networks can encompass a “tree graph” in an enterprise (hierarchical org chart), a “mesh network” of information exchange among friends and a collection of machines operating as a “society” (Internet with its distributed routers).

Some 15 years ago, while I was developing solutions to monitor large machinery such as a paper mill or a steel plant, we connected up the machine monitoring devices into a local gateway, sometimes wirelessly. This gateway led to the Internet and a server far away. The analysis of data done at the server provided machine condition information to the plant floor operators, to their foreman and plant manager. Some of them had laptops with connection to the corporate Wi-Fi. As you see, a full-fledged So-Mo-Clo system! The society of plant staff consumed the data provided by the server on mobile laptops. No smartphones then for SMS notifications . . .

Today, I am involved in developing a social commerce system using mobile phones that leverage the connections among friends where integration, messaging and commerce are executed on a platform on Azure cloud. A true full-blooded So-Mo-Clo solution! As you see things have not changed much but it has become a lot easier – my machinery solution took over a year to put together but the recent social commerce solution took 3 months! All the pieces are in place to apply the framework to a myriad of situations which has the potential to change the way we live.

Is there any problem that does not fall within the purview of So-Mo-Clo? I cannot think of any. In the mobile, cloud and social loop, all our work and play scenarios under CUS can be addressed.
·         My mobile app for finding a taxi: my “mobile” connected to the taxi dispatch “cloud” that interacts with the “society” of taxi companies that bid for my business on my mobile.
·         My enterprise sales team info-share network: I upload juicy tidbits (“CTO of “X” has recently moved to “Y”) into my company Sales Social network; my enterprise Active Directory disperses the information within the relevant portions of the org chart; my colleague in the relevant territory picks up the news and send me an SMS asking for tips about the prospect.
·         My enterprise Wi-Fi network: SNMP and 802.11k information is periodically updated to the IT diagnostic backend where a “heat map” is created; a dark spot is communicated to field engineers’ mobiles and the nearest one goes to the location to replace the AP.
When you are a hammer, every problem looks like a nail – perhaps; but to me, So-Mo-Clo framework seems to be pretty all-inclusive!

Business Case for So-Mo-Clo: Connected User Services
What is the monetization opportunity arising from the realization that So-Mo-Clo is a framework that can be applied widely?
1.       Productize it and sell the So-Mo-Clo platform to device+service companies that are in the CUS space (who isn’t?!); make it easy for them to add their specific services.
2.       Build your own device+service business and launch it.
3.       Major cloud and telco service providers offer So-Mo-Clo platform to all comers; lots of startups can get off the ground very quickly (attractive in emerging markets) and grow in response to market demand (till cloud costs become so prohibitive that you have to bring it in-house to your own data center; this is not all bad – it means that you have successfully created a huge business!).

Business Model #3 can be a threat to the first two in that So-Mo-Clo as a “feature” in a major offering such as Azure can subsume them. On the other hand, Business Model #1 has the advantage that it can be tailored for many applications. Let us consider an enterprise example. A full implementation can serve the entire organization; a mini-platform can be used by a department and a micro-version can be used for a project. Add to it document sharing, audio and video calling/ conferencing and you have an excellent cooperative-work solution.

So-Mo-Clo Architecture:
So-Mo-Clo architecture can be the framework to address any of the CUS scenarios described in the introduction section (the issue of “hammer and nails” notwithstanding). Things we call IoT (Internet of Things), M2M (Machine-to-Machine), Connected Devices etc. map into the architecture framework of the last section. In fact, with a generous definition of “user” in CUS, the framework is applicable to enterprise users, consumers and previously stand-alone devices.
  
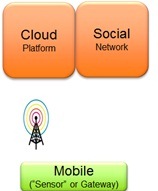
Reduced to its bare minimum, Cloud provides the computing platform for UX, data processing and intelligence. Social Network represents the “mesh connectivity” among the users and the intelligence embedded in the Cloud can use this infrastructure to understand and communicate insightful information (more about how to do this in the section on Social Networks) and not just raw data to interested parties within the “social” network.

Mobiles connect to the Cloud platform via wireless communication channels provided by MNOs or wireless+wired channels provided by ISPs. Mobiles may themselves be ends-points generating data (from the apps or audio/ video inputs) or they could be gateways aggregating data from other sensors (such as exercise monitors or glucose meters) connected to them via Bluetooth or USB cables.

When So-Mo-Clo is described in this generic fashion, it is clear that this is a classic M2M network or IoT for home automation! Add middleware for pub/sub protocols (AMQP, DDS or recently popular MQTT) to reduce network activity and implement Java OSGi Bundle technology to dynamically utilize on-premises or in-cloud computing resources; you have a highly elastic and multi-purpose So-Mo-Clo solution for a wide range of application domains! Connected Transportation, Meters & Sensors, Machines & Screens and of course, social commerce and other human endeavors fall within the umbrella.

Again, there may be a bit of over-reach on my part but the unifying vision is compelling I believe.

Security is of utmost concern in large consumer facing applications which typically call for So-Mo-Clo solutions. Web and mobile-web portals should be SSL based (https) for the transport layer security. The security can be augmented by the Unified Login and Form Authentication - store encrypted username and encrypted password in the data store and authenticate by comparison of encrypted (using the same key) inputs. Service API internal end-points and the Business Logic service internal end points should be secured. Because of the data sensitivity and the laws around the security of personal information, the access to data should be constrained by making sure that there are no endpoints for individual data access and only very specific endpoints are available for aggregated access of the data.

Some Trade Offs - A Personal Perspective:
There are many potential trade-offs in implementing So-Mo-Clo. Let me make it clear that I am technology agnostic. My personal preferences are as follows:
·         Mobile: Most applications require populating more than one form factor (mobile, tablet, laptop display); even within one such as mobile there are multiple sizes and resolutions.
o   HTML5 with associated native access libraries (such as PhoneGap) is mature enough today to provide best in class UI/UX. Developing for each native mobile app may be overkill.
o   Responsive UI design so that UI is pixel-perfect for any screen metrics is a must to assure outstanding UX.
·         Cloud: Many of the recent benchmarking studies put Azure and AWS neck and neck. Pricing works out to be similar.
o   Hence the choice is purely driven by familiarity. .Net programmers will prefer Azure for the continuity it provides in the development environment.
o   No cloud is a perfect utility (even our electrical utility fails once in a while); both Azure and AWS have gone down (not frequently). So the safe approach is to create redundant deployments on both Azure and AWS (or some other clouds) if your financial situation permits.
·         Social: Structure and storage affect performance as the network scale (number of users) grows large.
o   While many organizations such as business firms are structured as a “tree” in a hierarchical fashion, communication among the nodes (users) are in a “mesh” or many-to-many fashion.
o   Traversing a tree from a leaf-node via root to another leaf-node may become very inefficient in terms of latency if the tree is large. While it is seen that a relational database with Memcached is a reasonable way to manage latency, a true graph DB is the right storage for a multi-million node social network.

Social Networks:
To the initiated, “mobile” is well-understood and “cloud” is becoming better known. However, “social networking” and its profitable exploitation is still a black art. So here are some highlights.

In the last few decades, interest in Social Networks has seen explosive growth with Facebook being the poster child. Indeed work had gone on before that time in Physics especially in the area of “random network” (Erdos and Renyi are famous names). In such networks, each new node is randomly connected to any previous node and its evolution was studied. The work of Barabasi and others (Scale-Free Networks: A Decade and Beyond, Science, Vol 325, 24 July 2009; pp 412-413)showed that while the physics of Random Networks was interesting, it had little to do with “human made” networks such as Web, Internet, friendship networks, etc. They all fall into the category of “Scale-Free Networks” or SFN.

“Scale-free” in SFN refers to the nature of some networks where its diameter (average # of links to reach a node from the present node; remember “six degrees of separation” between people) is mostly unchanged as the network grows in size. SFN’s degree (# of links per node) is distributed as a power law (and not a binomial distribution which is the case for a purely random network). A well-known example of power law is Pareto distribution (“80/20 rule”). SFNs arise in networks that grow and have preferential attachment property while growing (exhibits “rich get richer” and “first mover advantage” phenomena).
Real social network has 3 major features:
1. Clusters (of friends who “hang out”).
2. Weak links (to your long forgotten high school classmates).
3. Hubs denoted by “H” (politicians and others with massive number of contacts).

 Comparing the Pareto (power law) distribution (top-right) that governs SFNs, we can see that Hubs with many links (large “k”) are nodes that occur rarely whereas Clusters with few links are nodes that occur very often. Here we elaborate a mid-scale situation where certain nodes have a fair number of links and occur with some frequency – we call them “Cluster Groups”. They arise in cases where a certain node belongs to multiple Clusters, their family cluster, work cluster, golf club cluster, etc. The same node belongs to many Clusters that are tightly coupled, leading to a Cluster Group.

Failure Modes: (1) SFN is robust to Failure and (2) SFN is vulnerable to attacks.
Failure means random loss of network elements such as some computers or local routers going down in the Internet. Attack refers to concerted take-down of major “hub” routers. It has been shown that removal of a small percent (15 to 20%) of “hub” routers will pull apart the network and “cascading failure” will spread (due to routers NOT under attack being unable to carry the extra load from “hub” routers) leading to total network failure.

The knowledge of failure modes has applications in the real world. Since Hubs (or “Influencers”) have the potential to be very helpful in spreading messages such as in a viral marketing campaign, it may pay to reward them with extra incentives. By the same token, we saw that a few Hubs leaving the network can cause “cascading failure” – if your business has a customer support feature (who doesn’t!), pay special attention when Hubs call in with a complaint – coddle them!
SFN Terms
In Real Life
What can they do?
How to Find?
Action
1. Cluster
Close friends
Influence economic activity
Found as most used in the Contact List
Make messaging easy
2. Weak Links
Distant acquaintances
Increase the network size
Found as seldom used in the Contact List
Message infrequently and mention context
3. Hubs
Powerhouse “connectors”
Keeps network robust
Algorithms
Value exchange messages

These insights beg the question – how do you find Hubs and other key influencers? Rooting through the graph and counting the number of attached nodes may be one way. While useful, this approach could be misleading in that some nodes created a lot of connections to them early on but there has been not much exchange of information lately. Here is a more elegant way to analyze the social graph and derive meaningful analytics from it.

Much of the work in social networks can be modeled and understood as the spread of infections in a population. In an IT context, we will talk in analogous terms of “mention of information or word” in a posting as indication of an “infection” (as in “that posting is infected by that particular word”).

Each Node has a different “influence function” – a Node talks about the “word” (Infection) to varying number of other Nodes (out of total of ‘N’ Nodes). Volume of Contagion for each infection (or word of interest/ significance) is the total number of mentions of the word in the network (for each of total ‘K’ words of interest).  In linear algebraic terms, Linear Influence (or Infection) Model is -

v = Mi
M - Influence Matrix (KxN);
v – Volume of Infection vector (Kx1);
i – Node Infection vector (Nx1)

To the initiated, this equation is a joy to behold in its simplicity and familiarity! Linear algebra has so many powerful tools, fast algorithms and practical insights that a lot of useful information can be extracted by the expert. In general, singular values and vectors (and related eigenvalues and vectors) of matrix, M, can tell you which nodes are the major “influencers” or Hubs, how big is their influence and even what forms the bases of their influence!

To apply this technique in practice, you will start with simulations of your social commerce network and predict Hubs, influence and other behavior. For those interested, I can provide MATLAB code that generate Scale Free Network of ‘N’ nodes and ‘d’ degrees (2 is typical for social networks) and some plotting routines. This is also the time to optimize your algorithms for large networks (large ‘N’ nodes) for matrix computations above as well as develop iterative or adaptive solutions so that you can study and predict network behavior over time with minimal computations.

Once your business is up and running, you can start replacing simulated data with historic data collected from your real network and apply the results and insights to your business to improve or control the viral spread of your marketing message or identify the Hubs to provide them with targeted incentives and so on.

Call to Action:
·         No more stand-alone devices - wrap a connected service at least for remote configuration and maintenance à “Connected User Services”.
·         Deliver service from the cloud; consider redundant cloud deployments of core functionality for 100% availability.
·         Mobile phones provide ideal interfaces for service and status information anywhere, anytime.
·         Adopt responsive design to be pixel-perfect for varying display form-factors.
·         Tier data connectivity according to their significance; time-shift and consolidate low-importance data upload to minimize mobile network activity.
·         Shared information creates a social network; add social analytics to provide useful metrics and insights to improve service delivery.

From the foregoing, it must be clear that So-Mo-Clo framework is a powerful one that brings together the power of wireless mobiles for “anytime anywhere” interactivity, cloud as a computing utility and social networking as an analytics tool to deliver end-to-end Connected User Services; applications are many and will impact all business segments. Whether you are a So-Mo-Clo platform vendor or a user, the solution framework is already past the feasibility threshold today and your insightful use will have a positive impact on your quarterly revenues!